
Why?
Advanced Analytics includes the use modern data engineering, data science, machine learning, and AI techniques and technologies in business processes and systems. By 2030, advanced analytics capabilities are projected to deliver an additional $ 13 trillion in economic activity globally. In the UK, that’s equivalent to an annual GDP increase of $ 310 billion (11 %) in just 10 years [1,2].
The National AI Strategy builds on the UK’s strengths but also represents the start of a step-change for AI in the UK, recognizing the power of AI to increase resilience, productivity, growth and innovation across the private and public sectors.
National AI Strategy, 2021. UK Government
These lofty growth projections are based on the core assumption for wide scale adoption and transformation of business strategies around advanced analytics. The potential is significant: from automation “smart-systems” that improve efficiency and productivity; predictive analytics to win more customers, provide better services, and to fine tune profit margins at scale; to complete transformation and disruption of existing business models.
The FAANG (Facebook “Meta”, Apple, Amazon, Netflix, and Google) and other Tech companies (e.g. Tik Tok, Snap, Baidu, Huawei etc) are utilizing advanced analytics at scale to drive revenue and to make eye watering profits. And yet, AI has not taken hold in most industries.
Research [6] shows that advanced analytics remains an emerging technology for private and third sector organisations in the UK:
- 27% of UK organisations have implemented AI technologies in business processes;
- 38% of organisations are planning and piloting AI technology; and
- 33% of organisations have not adopted AI and are not planning to.
This is despite an explosion during the past decade in the availability of data, open-source technology and software, industry and research networks, commoditisation of cloud computing, the rise of data engineering and data scientist roles, amongst others… So, what’s going on?
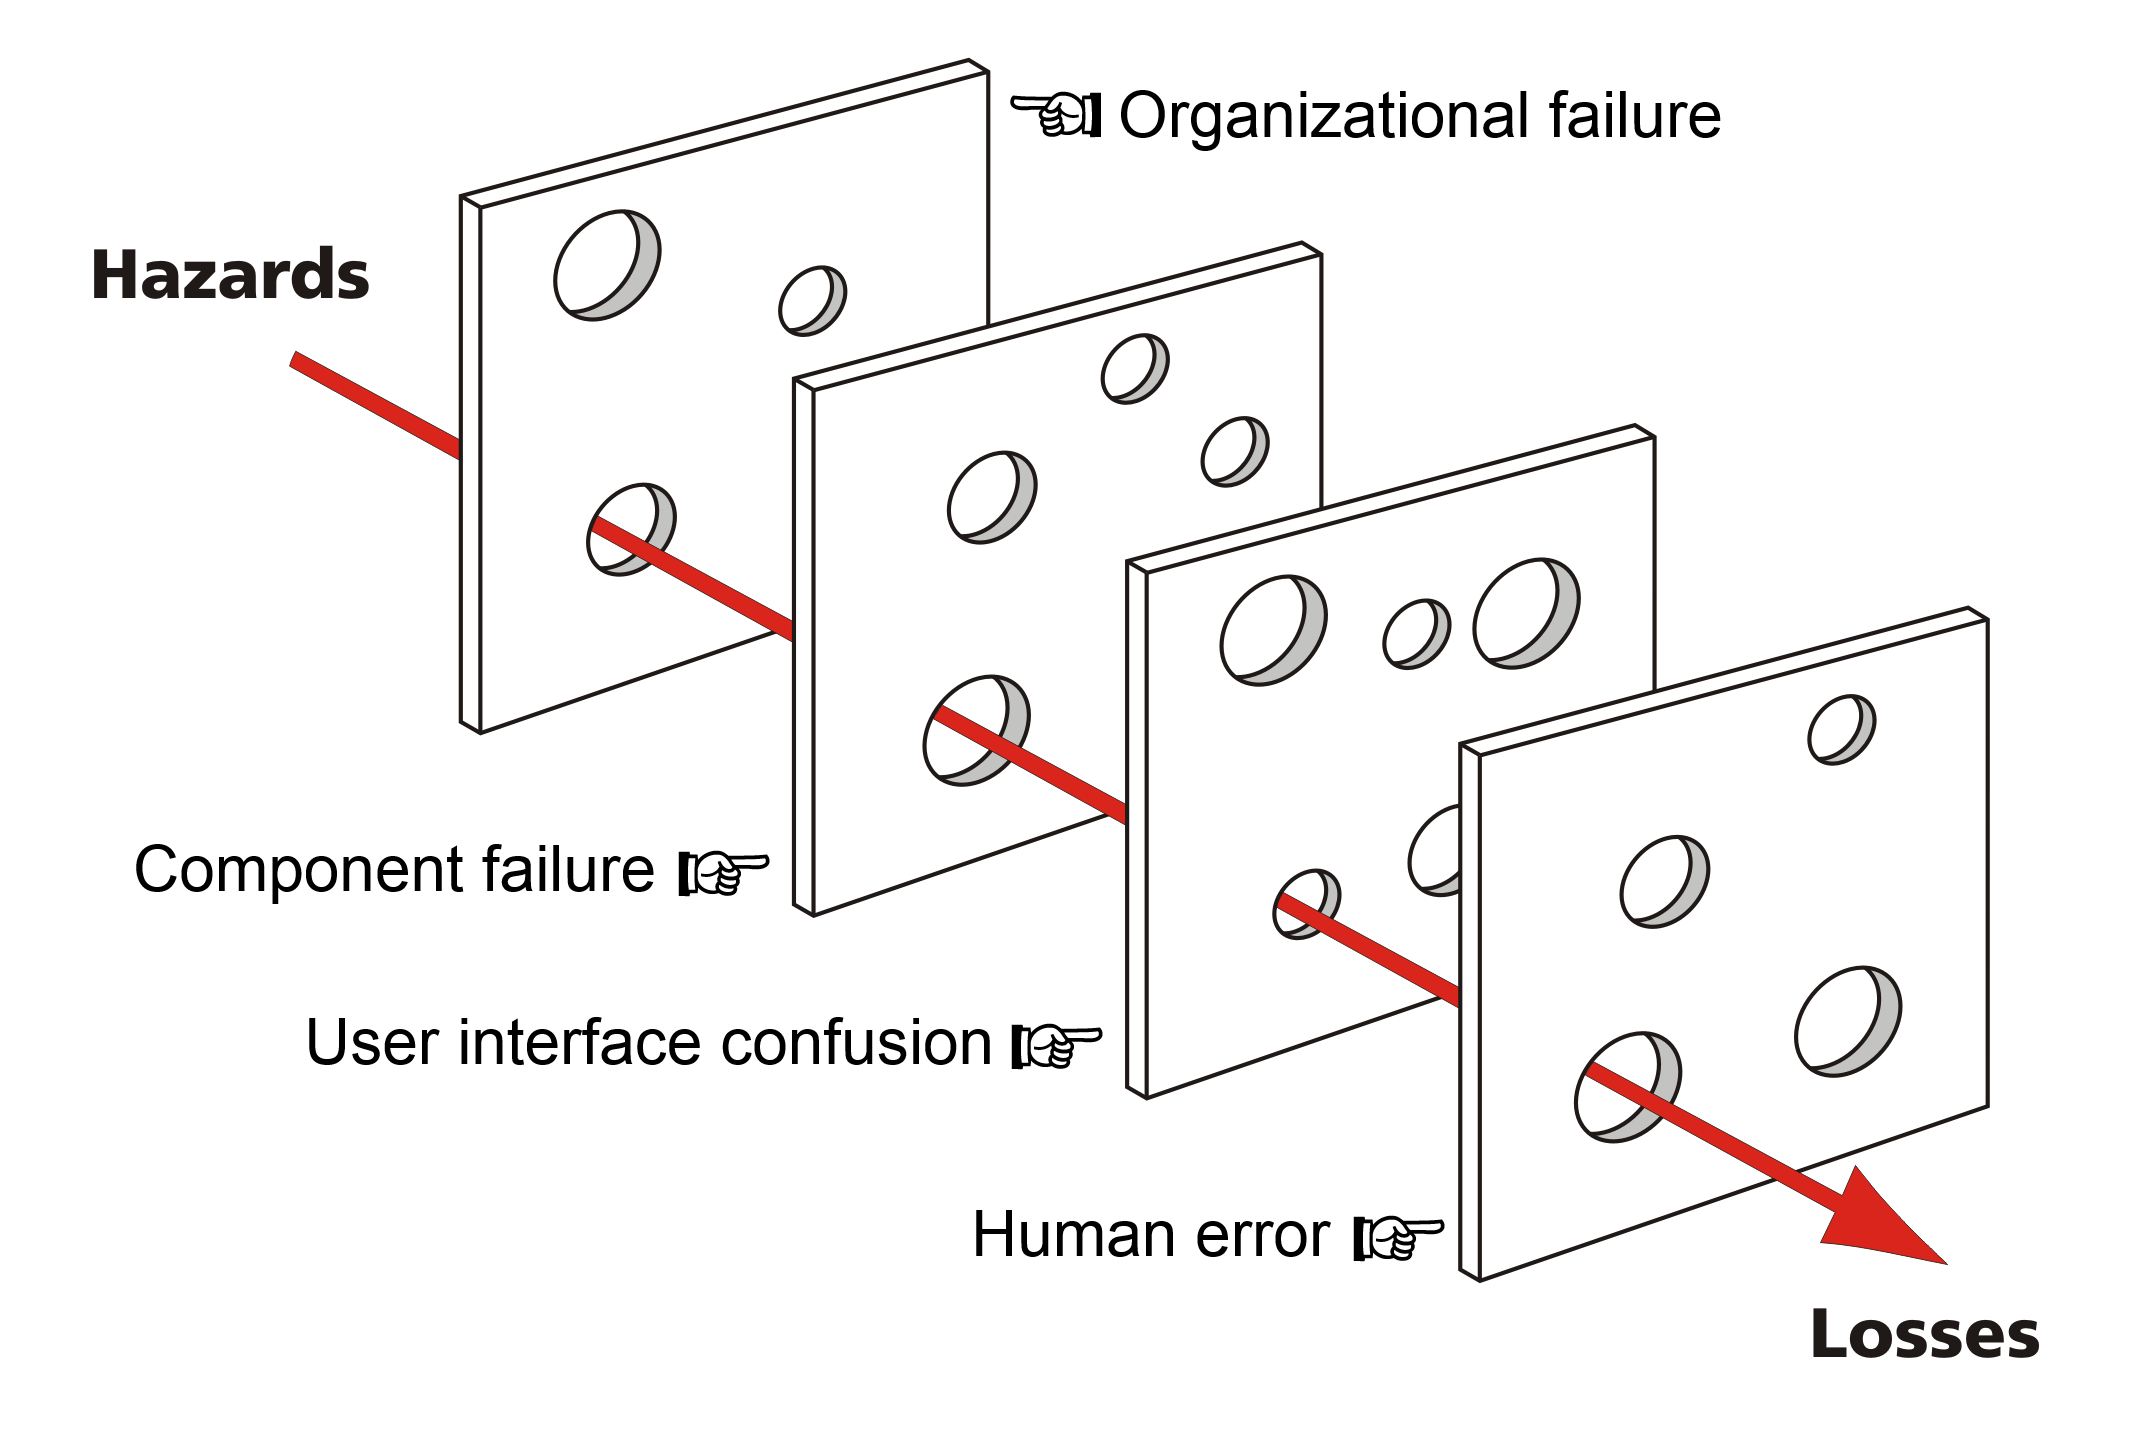
How do they fail?
Advanced analytics initiatives generally run into problems of:
High cost: Initiatives typically require high levels of investment in people and skills, technology, process modernisation and change.
High execution and operations risk: Poor strategic planning. The business must be seen to be doing something with advanced analytics. Projects are chosen and prioritised in line with the business strategy - expectations are high. Little regard has been given to the organisations data and analytics maturity. There is a lack of consultation and collaboration with the realities, capabilities, and people of the data, technology, and business operations functions. Subsequently, projects are chosen that have low feasibility of execution – leading to unmet expectations and executive disillusionment. Widely quoted figures from Gartner indicate that between 80-90% of initiatives fail [7].
High business risk: It is possible invest heavily in execution and operations and still fail. Adverse conditions and failures can arise in complex systems and that are hard to predict and control. Semi and fully autonomous advanced analytical systems that make tens of thousands to millions of predictions per day can lead to catastrophic societal and economic impacts. A no table example was Zillow’s Zestimate “Things started going south once Zillow’s prediction model started degrading. This resulted in the company buying properties at a much higher price than they were able to sell them for.” [5].
Strategy for success
First things first, take time getting to know and understand your organisations Business Model and Operating Model. The business model defines the strategy for how the company will make money (e.g., selling widgets in jurisdiction X via channel A). The operating model defines how the business is organised around the work necessary to deliver the business model (e.g., resources and investment required to produce widgets and distribute them via channel A). Seek out your companies’ experts to develop an appreciation of the market and industry domain conditions for why these two models are the way they are (e.g., which business areas and platforms are in a phase of growth, decline, maintain mode etc). Put them into context.
The second step is to create a common language and framework to discuss advanced analytics opportunities in relation to business model activity and value. Start by identifying and framing business opportunities and problems in simple terms against key performance metrics. There are several different frameworks and models you can follow here, such as lean canvas. Another is Simon Sinek’s golden circle [8]. For example, when working in insurance underwriting one of the core definitions was as simple as:
- Why: Increase underwriting profitability by X % for team Y
- How: Improve underwriting insights to enable teams to configure more profitable insurance products and terms
- What: Improve modelled risk scores to improve risk selection and to provide more accurate pricing estimates
The key is to identify and define as many opportunities as you can that tie back to the business model. Get feedback and involve as many people as you can. Your list should include ideas from the back and front offices, from the critical lights on activity, to the innovation and blue-sky fronts. These ideas can further be refined and triaged into themes by type, nature of business outcome, etc. Completing this activity will drive internal interest and create a catalogue of potential advanced analytic initiatives from across the business.
Step three involves assessing each of your opportunities against your operating model to gauge its feasibility. This step is where you seek to avoid, manage and minimise execution risk. Questions include: what is the high level conceptual and process model of the advanced analytics solution at a high level? Who is the key customer(s)? Who are the key blockers and enablers? What are the risks of failure? Are there any existing controls and limitations in place that your solution must work within? What degree of change management is required? What data is required? What resources and experience can the firm leverage?
The figure below is adapted from Holland (2019) [9]. It is useful to frame and map each opportunity against three key dimensions: business model change (x-axis), operational complexity or level of innovation (y-axis), and business value potential (size).
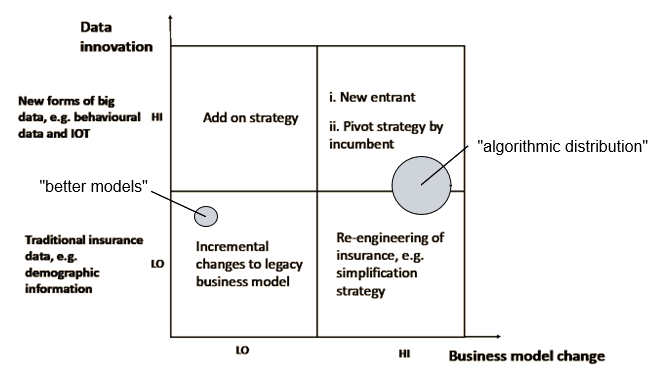
This creates four quadrants in which to categorise your initiatives: • LO – LO: “incremental change” to existing business model to improve existing business processes and data, without radically changing the logic of the business model. Lowest level of operating model change. • LO – HI: “add on strategy” approach embraces new forms of data but retains the existing business model. This strategy risks adding complexity and stress to the business and operating models. • HI – HI: “new entrant or pivot strategy”. Industry disruption via new business and operating models. E.g., advanced analytics are used to develop new insights, algorithms, and or distribution channels. • HI – LO: “re-engineering”. Re-engineer and re-deploy the products and services of the existing business model by driving simplification and scale of the operating model (e.g., automation and digitalisation, straight through processing).
My advice is to start with the short list of initiatives that fall into the first “LO-LO” quadrant. These will be your quick-wins, low-hanging fruits, path of least resistance etc.
The final consideration is delivery.
Data Products
A data product is a tool or application that uses data to help businesses make decisions. It can be used internally or sold to customers.
The two starter questions to ask here are: • What data products do you offer? • How do you deliver these data products to your customers?
Achieving a business outcome or goal will typically require a combination of two or more data products. For instance, a real-time decision support dashboard product may be fed by a mixture of derived and raw data products in addition to analysis pipelines and model data products. The specific data-product “range” that you offer is unique to each company and context but will usually include items such as: raw and derived data, analytics and insights, models and algorithms, to decision support and autonomous systems.
There may be a lot of variation in how data products are created and delivered – i.e., the business Operating Model. For instance, some data products are “artisan” products, carefully curated with input from various disparate data sources, subject matter experts with system and domain knowledge (e.g., heavily curated datasets, technical analysis, case studies etc). Other data products are generated through scalable and industrialised processes (e.g., automated data pipelines, IOT, API’s). These are heavily automated requiring higher levels of technical and engineering governance, 365 24/7 service level agreements, monitoring, error handling, etc. If need data products that utilise machine learning consider that there is a whole raft of supporting services, data, architecture and governance that need to be put in place to give these any chance of delivering business value.
Thinking of these in terms of business value levers can be useful. The value potential (load), and the leverage, effort and change required to implement and shift the operating model to get there.

Each data product has unique requirements in terms how it’s made, the people, processes, and technologies used to develop, maintain and improve the data-product throughout its lifecycle. Aim to have delivery pathways documented from start to finish and make them available to everyone – cast light on the key resources, teams, departments, technologies etc that comprise the supply chain of business value. This will help to speed development, highlight key dependencies, ease identification of improvements and efficiencies, and showcase how multi-disciplinary teams are contributing to the businesses advanced analytics goals.
Conclusion
Following the above framework will provide a catalogue of advanced analytic initiatives focused on business model value. Each initiative is categorised by it’s fit within the current business operating model and broken down into specific data products and delivery pathways that are required to make it real.
If this is a first step into advanced analytics focus your efforts on those initiatives and products that can be created by adding only small incremental changes to the current operating model and business capabilities. It’s highly likely that some analytical insights delivered via spreadsheets, presentations and dashboards will deliver 80% of your business value. And in turn will generate some valuable experience, improvements and talking points to build the case for investing and developing the operating model to cater for more advanced delivery pathways.
References
- Notes from the AI frontier modelling the impact of ai on the world economy, 2018. McKinsey Global Institute
- National AI Strategy, 2021. Office for Artificial Intelligence, Department for Digital, Culture, Media & Sport, and Department for Business, Energy & Industrial Strategy
- The economic impact of artificial intelligence on the UK economy, 2017. Price Waterhouse Coopers
- five infamous AI fails
- “How Zillow’s Grand Home-Buying Ambitions Imploded”
- Data foundations and AI adoption in the UK private and third sectors
- Gartner Says Nearly Half of CIOs Are Planning to Deploy Artificial Intelligence
- Golden Circle model: Simon Sinek’s theory of value proposition, start with why
- Artificial Intelligence (AI) and Emerging Business Models in Insurance
- The art of turning data into product